

Alarming implications for Hertfordshire of new national planning policy
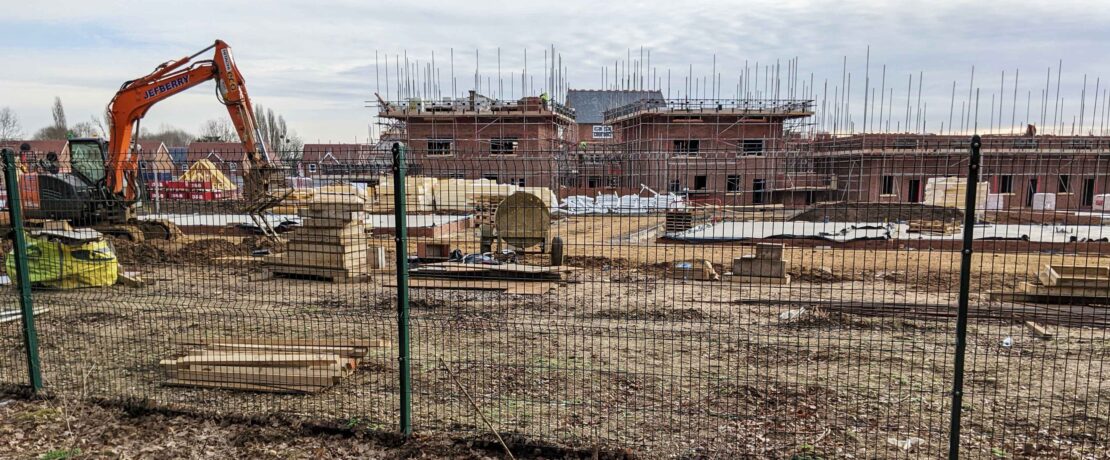
New Government formula for estimating housing need (‘standard method’), new policy on Green Belt, and introduction of ‘grey belt’ combine to create significant and alarming implications for the Hertfordshire countryside. These include higher housing targets and less protection for the Green Belt.
On 12 December 2024 the Government published the revised National Planning Policy Framework (NPPF). This follows on from a public consultation which received over 10,000 responses, including our own response. With over 800 changes from the previous NPPF, this has significant implications for the Hertfordshire countryside such as higher housing targets and less protection for the Green Belt.
Why has the government changed national planning policy?
The Government believes that economic growth can be boosted by delivering 1.5 million new dwellings and increased numbers of commercial facilities over the five-year period 2024 – 2029. The latter include ‘laboratories, gigafactories, data centres, digital infrastructure, freight and logistics’, and infrastructure such as large-scale wind and solar farms. The Government wants to enable this by changing national planning policy.
What are the main changes in the new NPPF?
The most significant changes in national planning policy from our perspective are a new Government formula for estimating housing need and setting housing targets, policy regarding changes to the Green Belt, and the introduction of ‘grey belt’.
New Government formula for estimating housing need
The Government has changed the way it calculates housing need. The new formula – ‘the standard method’ – uses as a base a proportion of existing housing stock to which it then adds a factor for Local Authority areas where local house prices are high relative to median local earnings.
This is meant to encourage the provision of more affordable housing and so inevitably the added factor is greater in places where house prices are highest, for example St Albans. The result of the formula for Hertfordshire is that the housing need calculation will be even higher than it is at present.
Housing need versus housing targets
Previously the Government-provided housing need figure was an advisory starting point from which local planning authorities could then take into account other considerations – such as designated protected land like the Green Belt and National Landscapes – in determining their own local housing targets. The new NPPF sets the expectation that the Government-provided housing need figure must be met in full. And so there is much more pressure for the housing need figure to become the Local Plan housing target.
Green Belt policy
The new NPPF also introduces hugely detrimental changes for the Green Belt. The new NPPF makes it a requirement for local authorities to review their Green Belt and adjust Green Belt boundaries if they cannot meet their housing need in full through other means, such as urban densification, brownfield regeneration, and building on land outside designated protected areas.
The ‘grey belt’
To make it even easier to build in the Green Belt, the new NPPF formally introduces the new concept of grey belt. Before the last election, grey belt was described as derelict petrol stations and disused car parks but that has changed. Grey belt is now defined in policy as “land in the Green Belt comprising previously developed land and/or any other land that, in either case, does not strongly contribute to any of purposes (a), (b), or (d) in paragraph 143. ‘Grey belt’ excludes land where the application of the policies relating to the areas or assets in footnote 7 (other than Green Belt) would provide a strong reason for refusing or restricting development” (Annex 2, page 73, NPPF).
What does this mean? It means a significant weakening of protection for much of the Green Belt. Any land in the Green Belt that does not “strongly contribute” to three of the five purposes of the Green Belt in the NPPF will be more vulnerable to development, as follows:
a.) to check the unrestricted sprawl of large built-up areas;
b.) to prevent neighbouring towns merging into one another; and/or
d.) to preserve the setting and special character of historic towns;
The second part of the NPPF definition of grey belt refers to paragraph 11, footnote 7 which notes that areas such as Sites of Special Scientific Interest, National Landscapes, National Parks, Local Green Spaces, irreplaceable habitats, and designated heritage assets do still enjoy a higher level of protection from inappropriate development, but the Green Belt has explicitly been removed.
The ’golden rules’
The new NPPF introduces a set of ‘golden rules’ that are intended to ensure that development on land that is in or released from the Green Belt provides a high proportion of affordable housing – up to a maximum of 50% – and the necessary infrastructure. However the Government has retained the capability for developers of quoting viability reasons to reduce the amount of affordable housing and infrastructure they are required to deliver. The Government had previously proposed tightening up the requirements for viability, but these will now be introduced later in Planning Practice Guidance expected in 2025.
What are the implications for Hertfordshire?
Taken altogether, the changes in national planning policy have negative implications for Hertfordshire.
Most of Hertfordshire’s local planning authorities now have much greater housing targets which will threaten the Green Belt. And with well over half of the land area in Hertfordshire being in the Green Belt, this means the likely loss of significant amounts of highly-valued open countryside to development.
Land released from the Green Belt in this way should meet the Government’s ‘Golden Rules’ including providing up to 50% affordable housing and the necessary infrastructure. In practice, because developers can quote viability reasons to reduce these commitments, developments may contain little affordable housing or accompanying infrastructure. We believe that inevitably local people will be unable to rent or buy genuinely affordable housing in their community.
New housing targets for Hertfordshire
Previously we published the highly alarming figures for housing need that would have resulted from the July 2024 proposed new standard method. Now under the new NPPF and the further change to the Government’s formula, housing targets for Hertfordshire are even higher.
Across Hertfordshire, every year our local authorities will need to deliver nearly 2,000 more dwellings than they would have under the old standard method. This is also nearly 500 more dwellings each year than under the July 2024 proposed formula. Details are shown in Table 1.
Table 1 – Housing need / targets, comparison under old and new standard methods
| Local Authority | Annual Housing Need – old standard method | Annual Housing Need – new standard method | Annual Increase / Decrease | Percentage Change |
| Broxbourne | 634 | 775 | + 141 | + 22% |
| Dacorum | 1016 | 1335 | + 319 | + 31% |
| East Herts | 1041 | 1265 | + 224 | + 22% |
| Hertsmere | 731 | 1034 | + 303 | + 41% |
| North Herts | 910 | 1018 | + 108 | + 12% |
| St Albans | 885 | 1660 | + 775 | + 88% |
| Stevenage | 470 | 478 | + 8 | + 2% |
| Three Rivers | 640 | 832 | + 192 | + 30% |
| Watford | 850 | 831 | – 19 | – 2% |
| Welwyn Hatfield | 910 | 848 | – 62 | – 7% |
| Hertfordshire | 8,087 | 10,076 | + 1,989 | + 25% |
Data source: UK Government, Outcome of the new standard method
The increase in housing targets will require an even greater increase in the number of dwellings that need to be completed each year, which is wholly unrealistic. Table 2 shows the staggering increase in housing completions that builders would need to deliver in order for local authorities to meet these new targets. This includes a 459% increase in Hertsmere Borough, a 332% increase in St Albans District, and a 312% increase in Three Rivers District.
Table 2 – Additional annual housing completions required to meet mandatory targets
| Local Authority | Annual Housing Need – new standard method | Average annual net additions (2020/21 – 2023/24) | Number additional completions needed each year | Percentage additional completions needed each year |
| Broxbourne | 775 | 486 | + 289 | + 59% |
| Dacorum | 1335 | 630 | + 705 | + 112% |
| East Herts | 1265 | 1009 | + 256 | + 25% |
| Hertsmere | 1034 | 185 | + 849 | + 459% |
| North Herts | 1018 | 403 | + 615 | + 153% |
| St Albans | 1660 | 384 | + 1276 | + 332% |
| Stevenage | 478 | 129 | + 349 | + 271% |
| Three Rivers | 832 | 202 | + 630 | + 312% |
| Watford | 831 | 762 | + 69 | + 9% |
| Welwyn Hatfield | 848 | 341 | + 507 | + 149% |
| Hertfordshire | 10,076 | 4,531 | 5,545 | + 122% |
Data source: UK Government, Outcome of the new standard method
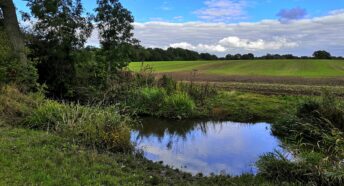
None of this is good news for the Hertfordshire countryside, which will clearly be under massively-increased pressure for development.
What next?
We believe the countryside is worth fighting for. CPRE Hertfordshire will continue to work within the planning system to promote and protect the countryside from inappropriate development. Once it’s built on, it’s gone forever.
Please support our countryside mission
If you are concerned about the impact on the countryside of the Government’s drive for growth and the new national planning policy, please join or donate. We are a membership charity and it’s quick and easy to join online, all are welcome. Or make a donation – we hugely appreciate all donations of any amount however large or small.
Thank you for your support.